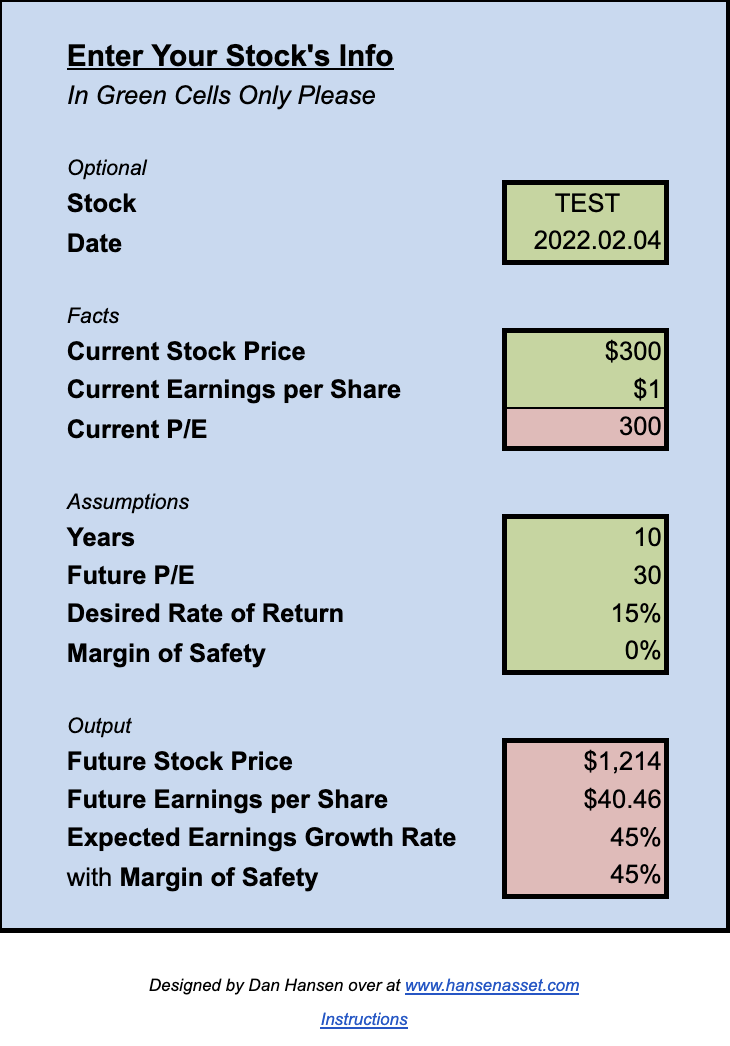
(Go to ‘File -> Make a copy’ to edit)
WARNING: This is just an educational tool. It’s been simplified to ignore share dilution, dividends, and a million other variables.
When you’re looking at a growth stock, it’s important to understand what assumptions are built into the stock price. If a company currently has a PE of around 300, then the market is predicting high earnings growth into the future. The idea being, that the company will grow into that high multiple. But the company can’t stay in a growth phase forever. Eventually, the growth prospects will diminish and the company will mature. Therefore, the PE multiple will deflate to something more reasonable. As I write this [edit: 2015], the S&P500 has a PE of about 21. Mature companies with (supposedly) better than average expected growth prospects are trading in the 30-40 range (V or MSFT). That fall from around 300 to around 30 would act as a weight around the stock price’s neck.
This PE Deflator helps you find what rate the earnings will have to grow at to outweigh the PE falling and still provide a reasonable rate of return to shareholders.
There are 7 green cells where you can enter values.
INPUT:
1) Stock – Enter the stock ticker. (optional)
2) Date – Enter today’s date. (optional)
3) Current Stock Price – Can be found with a quick Google search. For this example, I put 300.
4) Current Earnings per Share – I recommend using roic.ai. I put $1 so the Current PE would be 300.
5) Years – In any calculation like this, you have to define the time period. Here, I use 10 years out of pure convention.
6) Future P/E – This is a pure guess. Eventually we know that as the company matures, the PE must deflate to a lower PE multiple. It can’t stay around 300 forever. So using 10 years as a yardstick, I’m going to assume that the PE is 30 in 2025. Pure speculation on my part. You’ll test a few different future PE’s at the end.
Note: You can replace P/E with your preferred multiple.
7) Desired Rate of Return – This is the rate of return that you’re expecting out of your investment. Your hurdle rate. I’m putting 15%. 10% is the SP500’s historical average, but who invests in a highly speculative growth stock looking to do average?
Note: Don’t touch the red cells unless you want to figure out the math for yourself.
OUTPUT:
1) Future Stock Price – Given our assumptions, the stock price will be $1,214 in 10 years.
2) Future Earnings per Share – Given our assumptions, future earnings per share will be $40.46 in 10 years.
3) Expected Earnings Growth Rate – This is the rate at which earnings would have to grow over the next 10 years in order to counter-act the PE deflation (from 300 to 30 in this example) and still appreciate the stock price at a rate of 15%. In this case, the expected earnings growth is an astounding 45%.
Here’s where I leave it to you to play around with the assumptions yourself. Go to ‘File -> Make a copy.’ What happens if you change the Future P/E to 50? to 75? to 20? What about if you change the years from 10 to 5? Use it on your own investment ideas. Have fun and good luck.
Written 2015. Edited 2023.
